Visualizing Neocities Communities
Neocities is a nice hosting service. When you are just starting, getting a free service enables you to learn at your own pace. It only hosts static files, nothing else in running in. On their main page, you can search for other website they host based on tags. Tags are not unlimited, you need to select the most relevant ones. Also, as any social network, you see which website they follow and which are following. We propose to explore this community on this attack angle.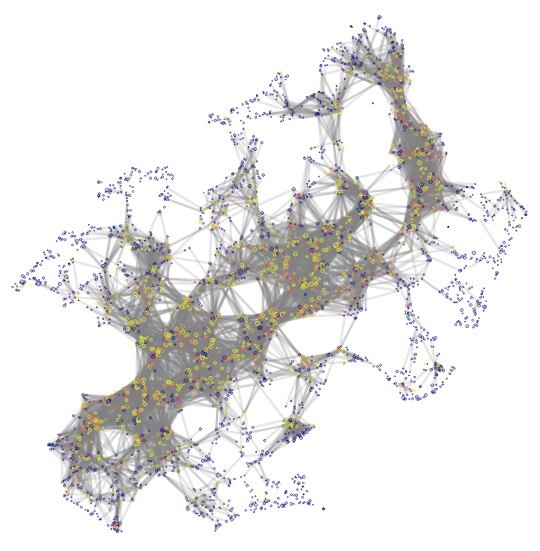
Introduction
My question was “is there any structure ? Clusters or disjoint communities ?”. To answer these questions, I gathered two information:
- Who follow what (for network construction)
- Tags (for post analysis)
Gathering Data
There is no dedicated API to gather information on the Neocities website.
So I gathered the .html pages and extracted the necessary information.
Processing Data
Nodes Connectivity
We collected information about 12,531 websites.
There are four types of websites:
- Websites that are following and are followed (very active)
- Websites that are not following and are followed (super star)
- Websites that are following and are not followed (active, but not popular)
- Websites that are not following and are not followed (not active at all)
| Following | Followed | # | % |
|---|---|---|---|
| Y | Y | 2481 | 20 |
| N | Y | 2853 | 23 |
| Y | N | 6413 | 51 |
| N | N | 784 | 6 |
OK, this is without paying attention to the follower number.
So most people engage in Neocities activities, as there are only 6\% of people that are not discovered nor discovering.
Filtering
When performing graph analysis, it is always difficult to process nodes with very few connections. I decided to discard websites which did not belong to the largest connected components, and following less than $5$ other websites (at the date of 27th of April 2022, I am excluded from my own analysis).
Tags
I wanted first to exploit tags, but unfortunately, very few websites add them on their profile.
32\% of them have no tag at all, and the max is 5 (this is limited by the system).
This would be very hard to use, so I keep them for post-analysis.
| Tag count | Proportion (%) |
|---|---|
| 0 | 32 |
| 1 | 21 |
| 2 | 7 |
| 3 | 9 |
| 4 | 9 |
| 5 | 20 |
The keywords’ distribution follows a power-law: very few keywords are largely represented while many others are not. This is also a point preventing from doing a tag analysis, as we may not observe significant differences.
| Range | \(\geq 1000\) | \(> x \geq 100\) | \(> x \geq 10\) | \(> x > 1\) | \(x = 1\) |
|---|---|---|---|---|---|
| Count | 2 | 21 | 336 | 1760 | 5213 |
You can see that the majority of the tags are unique.
We can list the top ones and their number of occurrences:
| Tag | # |
|---|---|
| art | 1664 |
| music | 1070 |
| personal | 950 |
| videogames | 939 |
| programming | 919 |
| games | 392 |
| anime | 369 |
| blog | 348 |
| writing | 322 |
| design | 197 |
| food | 168 |
| technology | 162 |
| html | 155 |
| 90s | 154 |
| education | 135 |
| gaming | 133 |
| photography | 129 |
| comics | 126 |
| javascript | 115 |
| fun | 114 |
| movies | 105 |
| retro | 102 |
| game | 101 |
On the official website here, you can see all the first tag sorted by frequency. For some reasons, I don’t have exactly the same list, but most terms are in both list.
Transformation
To represent the neighborhood of a node, I performed a Random Walk, where all nodes get weighted based on their accessibility from the current node. (See previous articles where the process is described).
Results
I obtained the following result:
Note: Use the mouse, zoom, and click to explore the graph. This is interactive.
I displayed some of the links between websites.
Some were discarded for readability (if the length of an edge exceeded 10 units, it was discarded).
The color is proportional to the number of tags. Yellow color means that the five tags are used.
Size is proportional to the log number of followers (log is necessary, otherwise you would have large potatoes covering the full space and very thin dots).
What you can see is a backbone which is composed of the largest websites in the middle. These website are characterized by their number of tags: popular websites use tags, not-so-popular do not.
Then, there are peripheral nodes with almost no followers (size feature on the plot).
This is not surprising, as weakly connected items are easier to place on the map because there are less constraints on them.
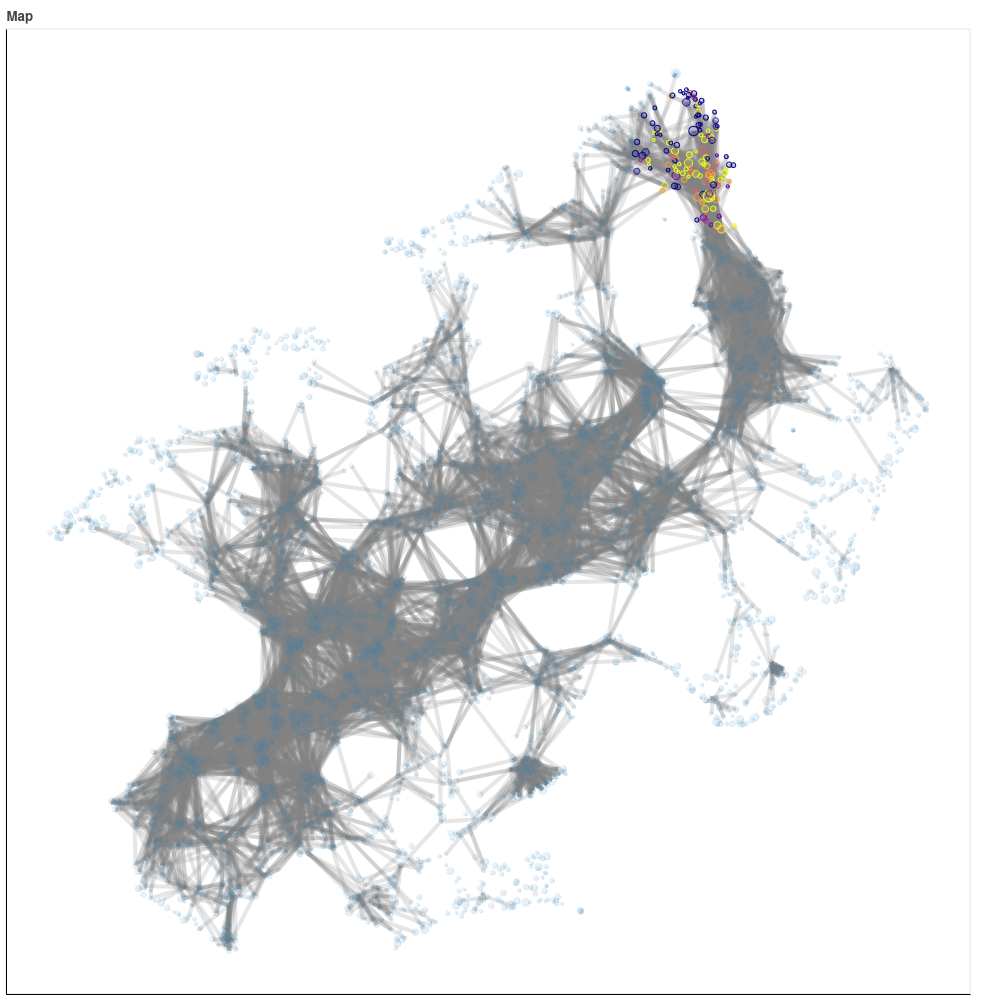
Communities analysis
As tags are displayed, you can look to which communities nodes belong to. Use the lasso tool to get access to it.
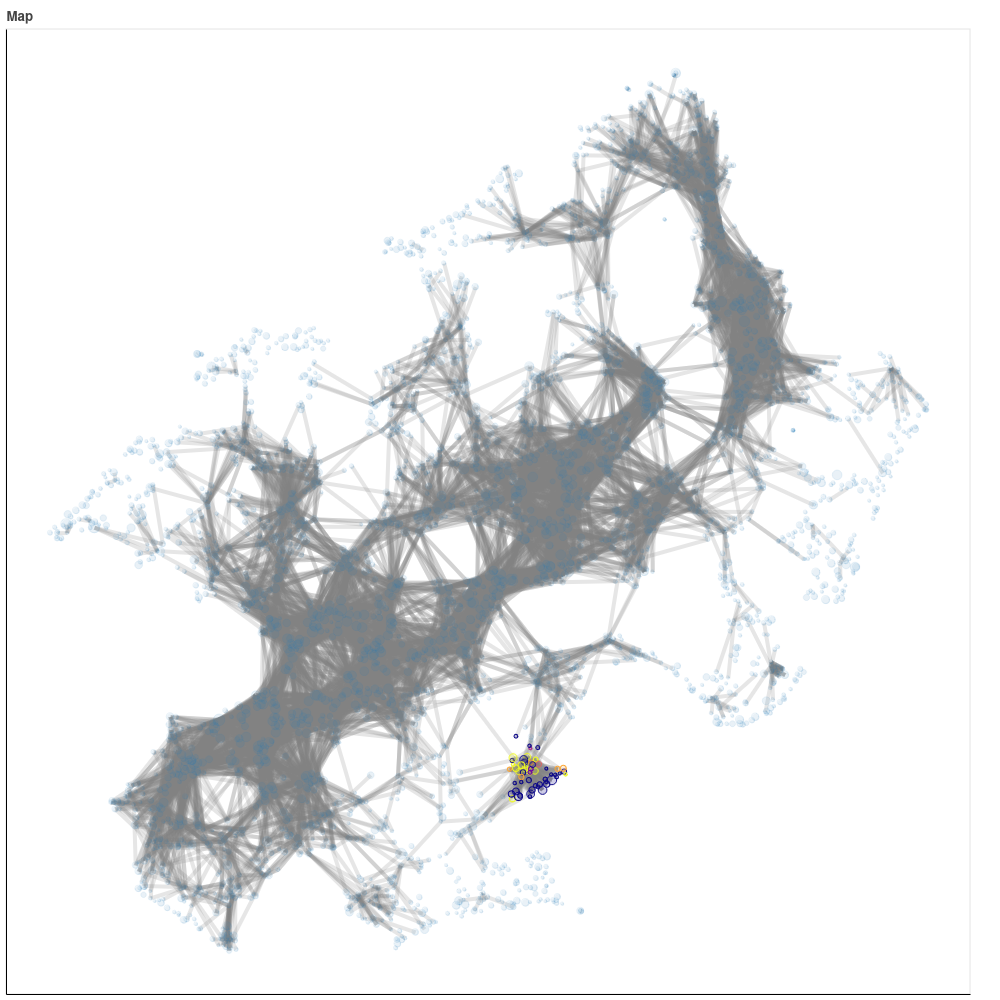
For instance, on the left highlighted group, this is about goths (you have keywords such as gothic, lolita, dolls, fashion, etc.)
By contrast, on the right highlighted group, this is about tech (you can see keywords such as programming, tech, webgl, cyberpunk, etc.)
Where I am ? I don’t have that many followers and I don’t follow that much, so I am not here !
Next Step ?
Keywords analysis ?
What is the most efficient strategies to reach the backbone of the communities (which person should you follow ?).
>> You can subscribe to my mailing list here for a monthly update. <<